


Poor Inflation Data Pushes Bitcoin Below $60,000
Bearish CPI data has led to further Bitcoin weakness and may likely continue as inflation persists.

Bitcoin not only closed its third consecutive bearish day, but also fell below its daily 21 and 55 EMAs. The release of CPI data, which came in higher than expected, further compounded Bitcoin's struggles.

The bearish economic data indicates that inflation is still persistent and growing. This led BTC to drop to a low of $58,950 overnight before bouncing back above $60,000 to current price levels. A fourth consecutive bearish day seems likely, and we could see BTC continue to decline. However, as noted in previous morning updates, Bitcoin remains in a long-term bullish structure as long as it stays above $57,500.
In other asset classes, Gold experienced the opposite reaction to Bitcoin, rallying on the back of the CPI data due to its status as a 'safer' asset. The DXY (USD Index) exhibited major volatility, initially dropping before rallying after the event. Meanwhile, the S&P 500 opened lower compared to Thursday’s close, traded sideways for most of the session, and closed slightly higher than its opening level.
This CPI data will be a significant factor influencing the Federal Reserve’s decision on interest rate cuts at the next meeting on November 7, assuming they do cut. Current market sentiment favors an 86.9% chance of a 50 basis point cut, up from 67.9% a week ago.
Stormrake Spotlight: SUI ($1.83)
SUI showed strong recovery after a volatile session. It started the day at $1.86 and fell over 6% within three hours following the CPI data, before rebounding to $1.83. This resilience suggests bullish potential for SUI once the broader market sentiment improves. Investors should keep a close watch on this altcoin.
BTC/USD Key Levels and Price Action:
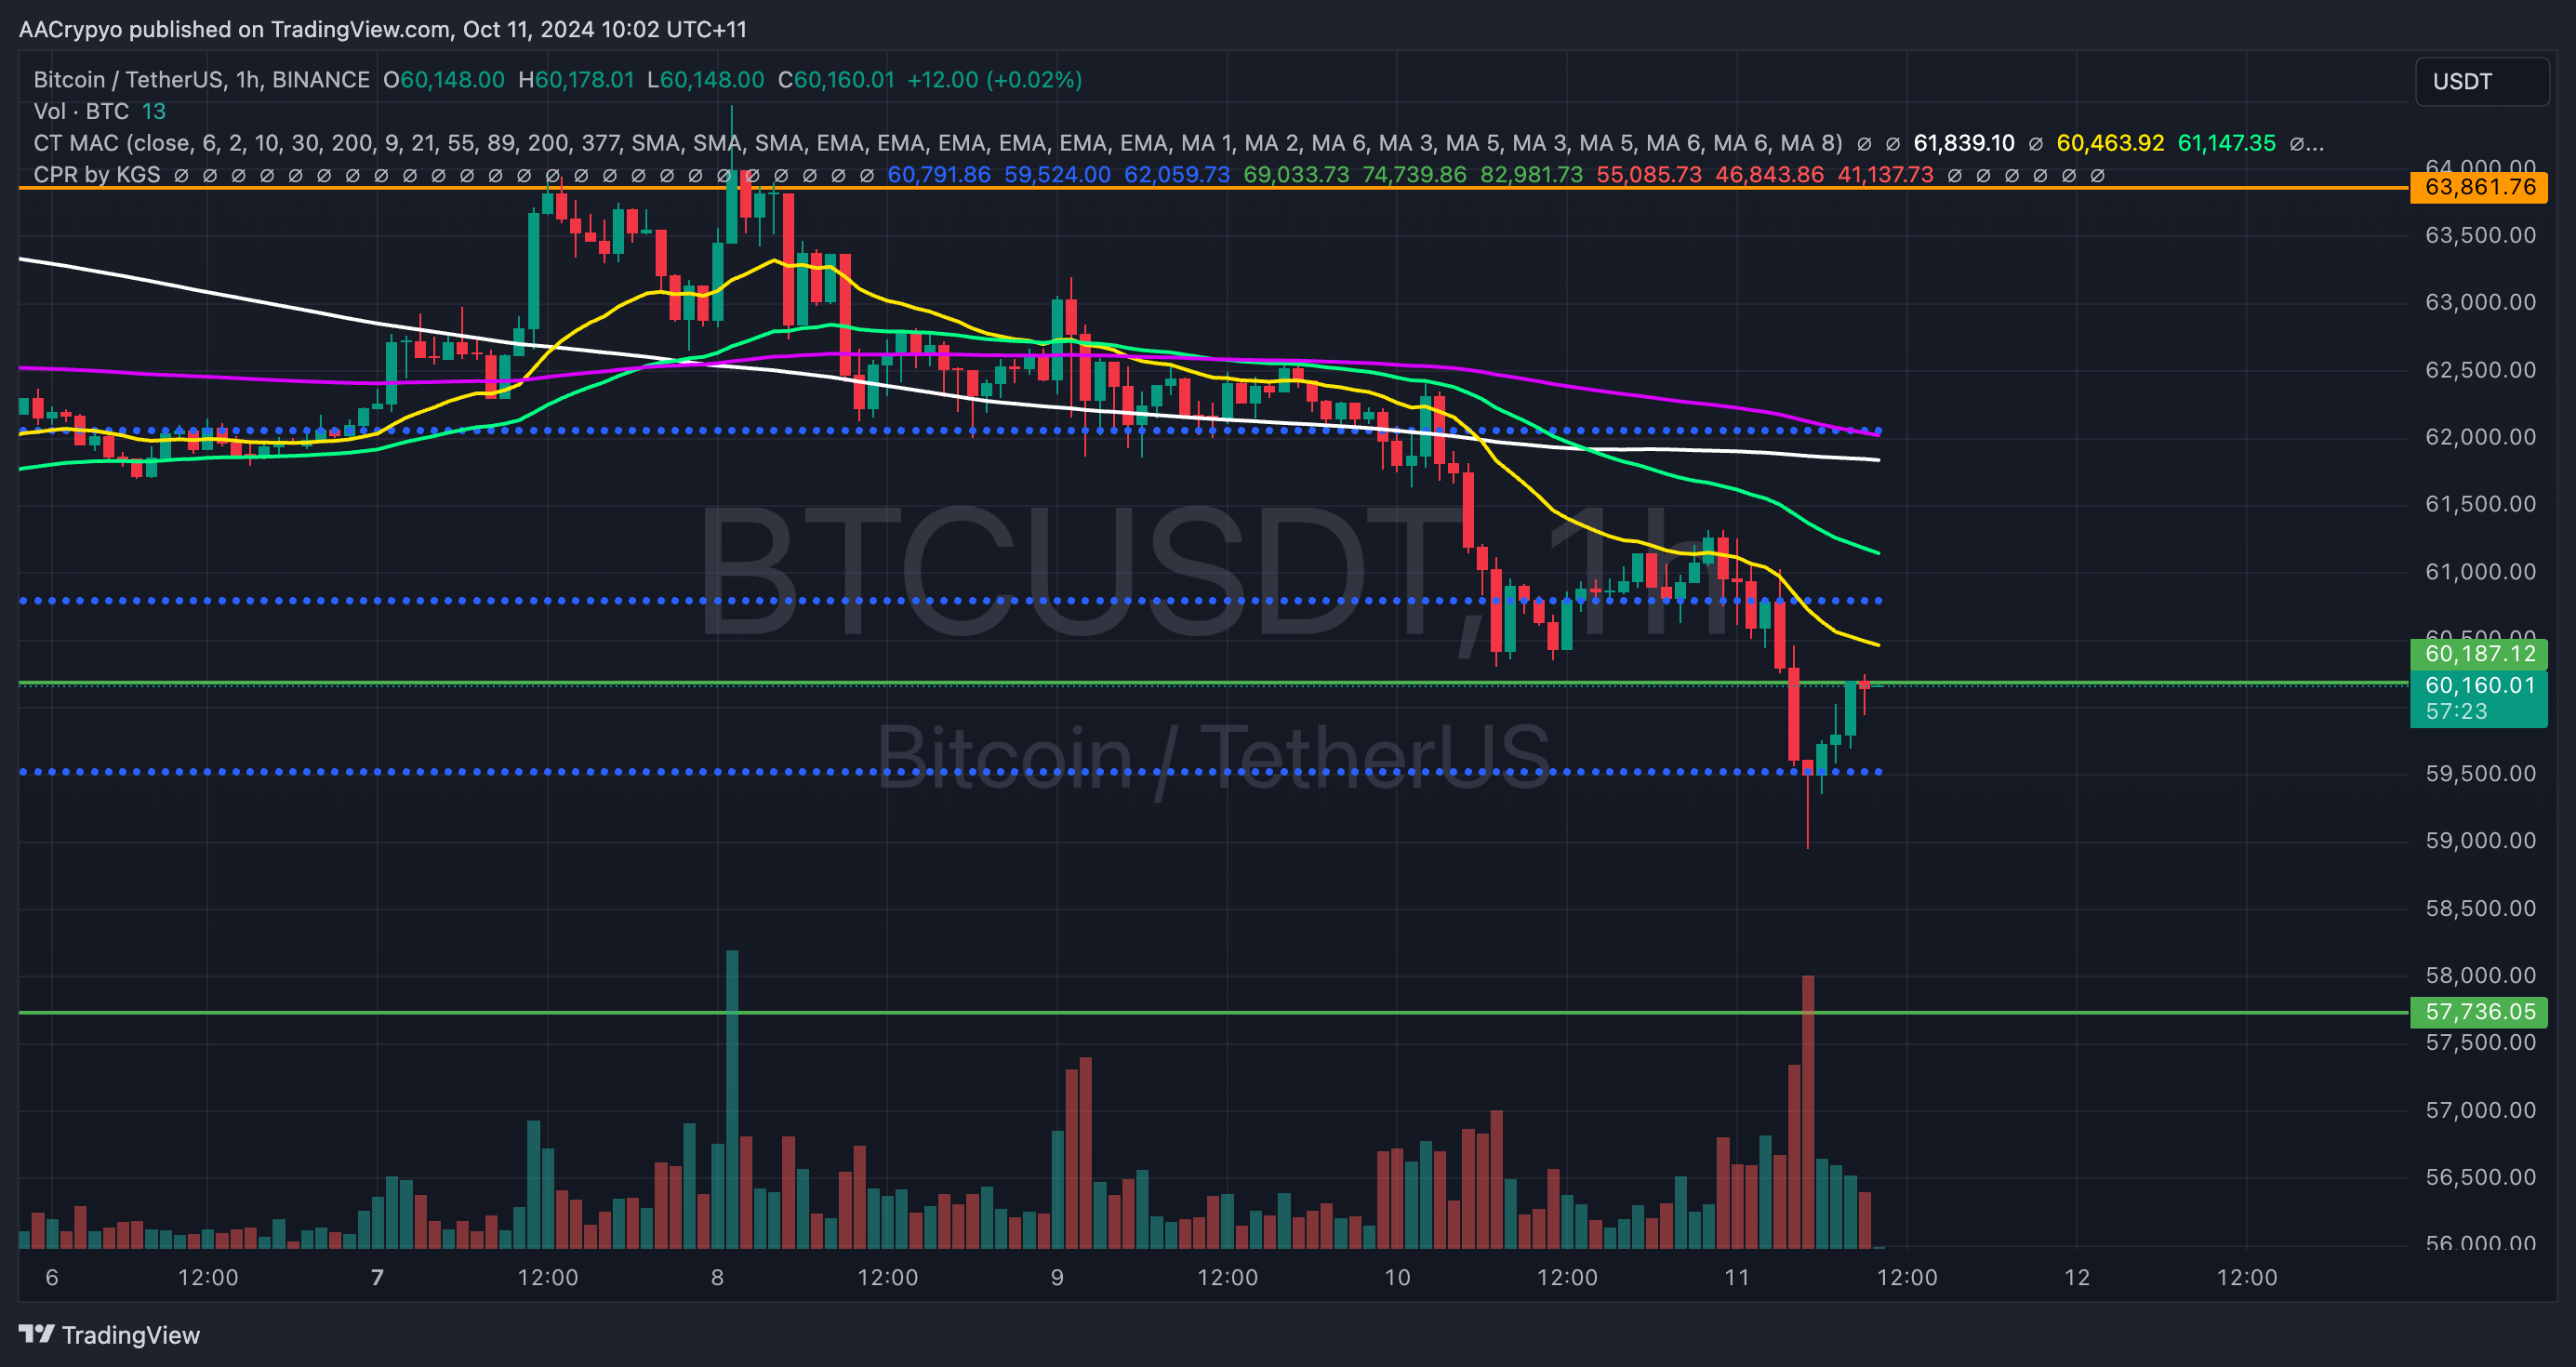
As anticipated, Bitcoin reached its bottom monthly CPR level at $59,500, though it failed to close below it. BTC remains bearish in the short term, as the former support level of $60,187 has now turned into resistance. It also remains below all moving averages, and without a spark of bullish momentum, it is likely to struggle breaking above the 21 or 55 EMAs. The downside bias persists, with $59,500 as key support. However, should BTC break above the current moving average resistance, the next target is $62,000.
BTC Total ETF Flows for 10 Oct: $ - 6.2 million
(ETF flow data is sourced from https://farside.co.uk/btc/ and reflects figures at the time of writing.)
ETH/USD Key Levels and Price Action:
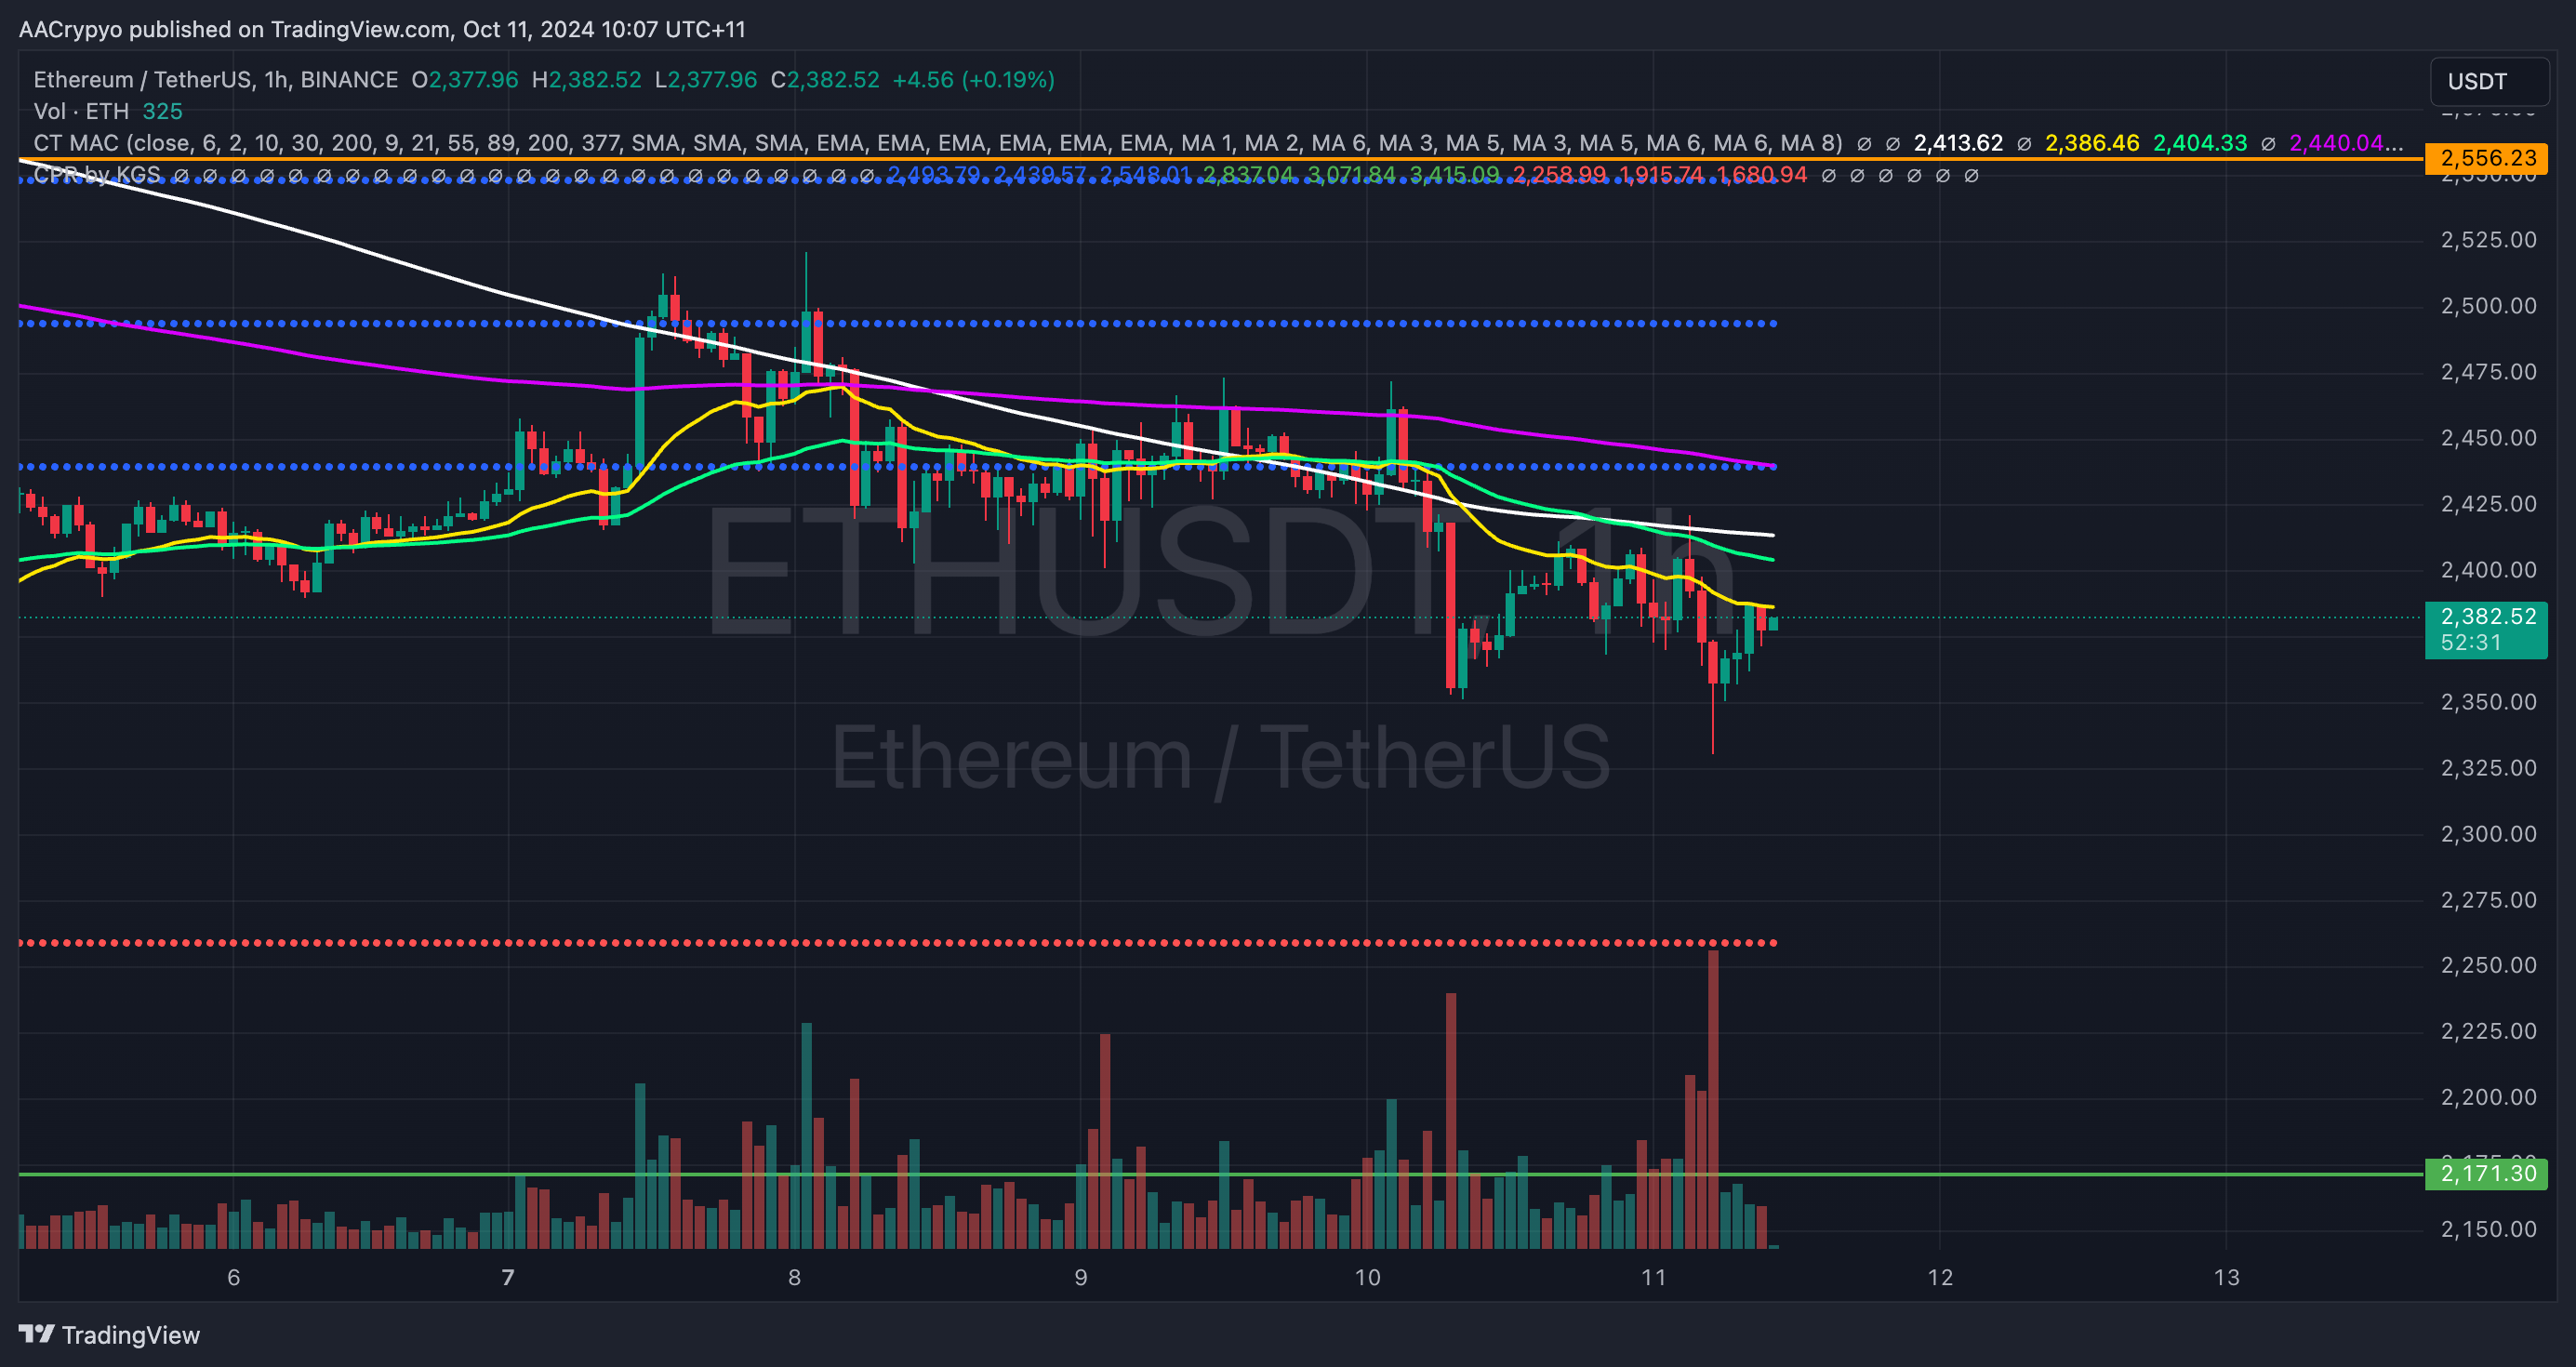
Ethereum continues its downward trajectory toward the monthly support CPR level of $2,260, struggling to break above any of its moving averages. Should ETH manage to reverse the downtrend and break above the 21 and 55 EMAs, we could expect a rally back to the bottom blue CPR line at $2,440.
ETH Total ETF Flows for 10 Oct: $ - 4.2 million
(ETF flow data is sourced from https://farside.co.uk/eth/ and reflects figures at the time of writing.)
Written by Alexandar Artis
To view this article and many others on our blog - please click HERE
If you enjoyed this Morning Note, feel free to open an account and gain access to more proprietary research and work with your very own dedicated crypto broker.
Disclaimer
All statements made in this material are made in good faith and we believe they are accurate and reliable. Stormrake does not give any warranty as to the accuracy, reliability or completeness of information that is contained here, except insofar as any liability under statute cannot be excluded. Stormrake, its directors, employees and their representatives do not accept any liability for any error or omission in this newsletter or for any resulting loss or damage suffered by the recipient or any other person. Unless otherwise specified, copyright of information provided in this newsletter is owned by Stormrake. You may not alter or modify this information in any way, including the removal of this copyright notice.