


Is Alt Season Here?
ETH/BTC looks to have bottomed. Ethereum is showing strength against Bitcoin, what does this mean for the crypto market?

While Bitcoin has been moving sideways for a few days, hovering around the key level of $63.8k, Ethereum has continued to rally. The ETH/BTC daily chart below shows Ethereum finally breaking out against Bitcoin after being in a two-month downtrend. It looks as if ETH/BTC has bottomed and may continue to rise against BTC.

Could this be the first sign of an altcoin season? We know there are stages within a bull run: first, Bitcoin rallies (done); then Ethereum follows (now?); and finally, altcoins take the stage. The strength in ETH/BTC suggests that people might be starting to rotate their BTC into ETH, which could signal the next phase of the bull run. However, it’s still too early to definitively call the next stage, though the signs are starting to appear.
Stormrake Spotlight: ETHEREUM ($2,645)
Last week’s spotlight, FTM, delivered a return of just under 30%. This week, we’re keeping it simple with Ethereum. As mentioned earlier, Ethereum’s strength is a positive indicator for both the crypto space and the bull market. It’s likely that Ethereum will continue to show strength and move higher.
BTC/USD Key Levels and Price Action:
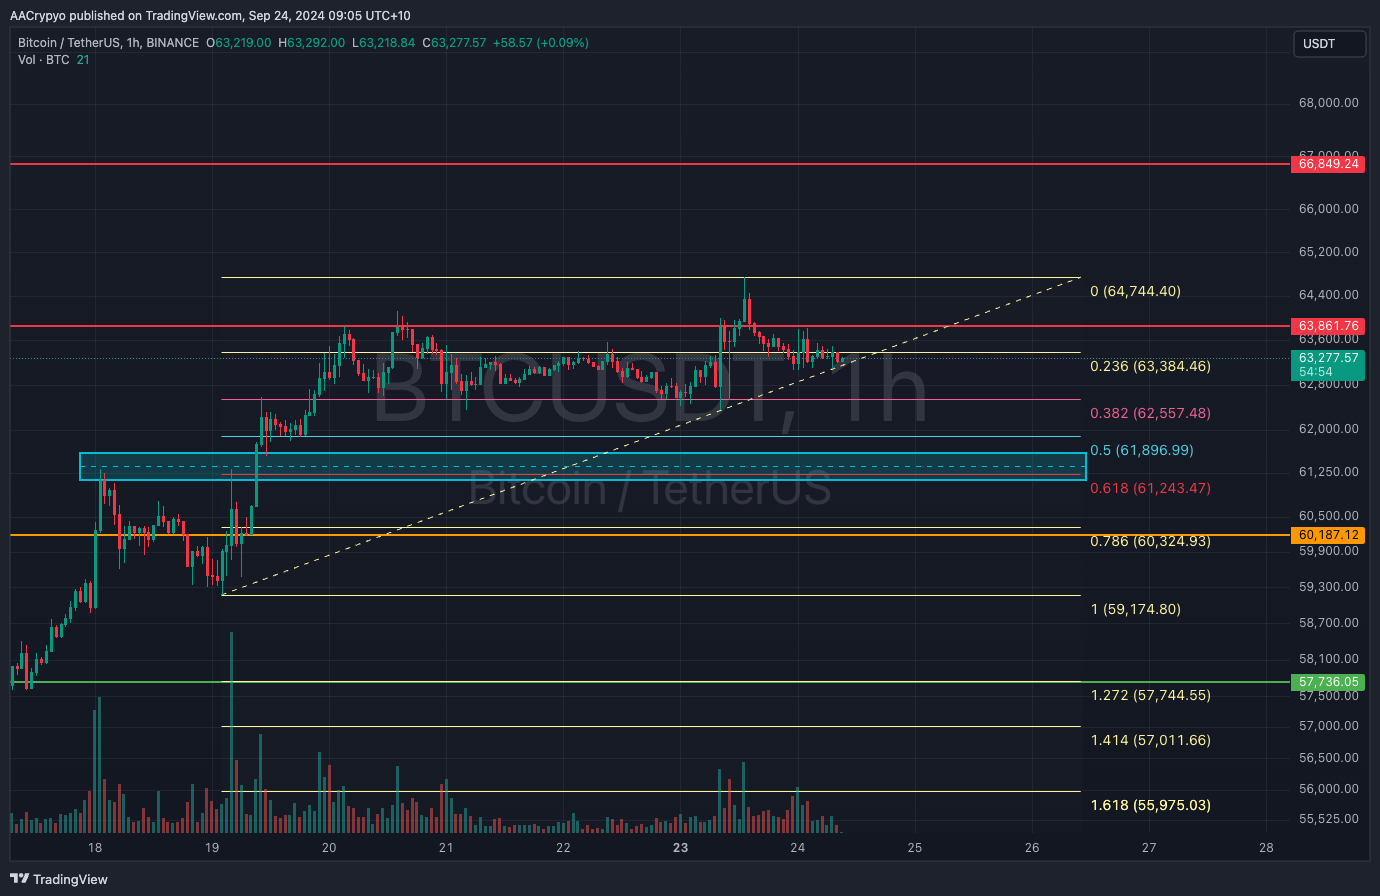
Four days after testing the key resistance level of $63.8k, Bitcoin has struggled to stay above it. There have been a couple of attempts to break through, but they were quickly reversed. The more often a resistance level is tested, the weaker it becomes, which is a positive sign for Bitcoin bulls. The shallow Fibonacci retracement level at 0.382 ($62.5k) has provided BTC with support. Currently, Bitcoin is trading within a very tight range between $62.5k and $63.8k. A breakdown from this range could see BTC retrace to the golden Fibonacci pocket within the blue rectangle, between $61.2k and $62.8k. A confirmed breakout, however, could propel BTC towards $66.8k.
BTC Total ETF Flows for 23 Sep: $ - 31.9 million
(ETF flow data is sourced from https://farside.co.uk/btc/ and reflects figures at the time of writing.)
ETH/USD Key Levels and Price Action:
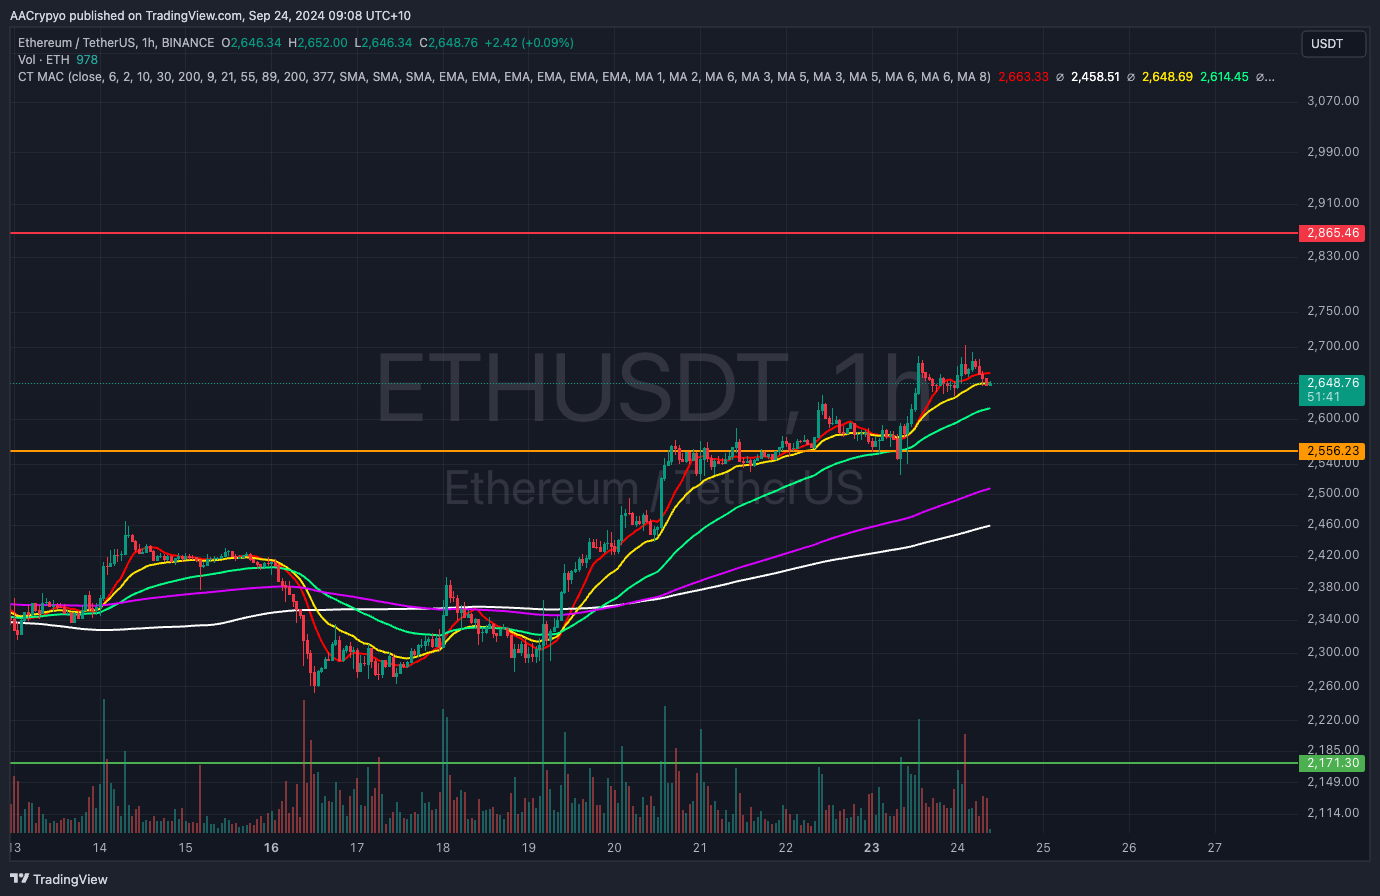
While Bitcoin has been consolidating over the past four days, Ethereum has surged ahead, breaking through the key resistance level at $2,556. The next target for ETH is $2,865, while the previous resistance at $2,556 has now turned into key support. A closer support level has been the 21-day EMA (yellow line), which Ethereum has bounced off of consistently as it rises. If the 21-day EMA breaks, the 55-day EMA is expected to provide further support around $2,614.
ETH Total ETF Flows for 23 Sep: $ - 80.6 million
(ETF flow data is sourced from https://farside.co.uk/eth/ and reflects figures at the time of writing.)
Written by Alexandar Artis
To view this article and many others on our blog - please click HERE
If you enjoyed this Morning Note, feel free to open an account and gain access to more proprietary research and work with your very own dedicated crypto broker.
Disclaimer
All statements made in this material are made in good faith and we believe they are accurate and reliable. Stormrake does not give any warranty as to the accuracy, reliability or completeness of information that is contained here, except insofar as any liability under statute cannot be excluded. Stormrake, its directors, employees and their representatives do not accept any liability for any error or omission in this newsletter or for any resulting loss or damage suffered by the recipient or any other person. Unless otherwise specified, copyright of information provided in this newsletter is owned by Stormrake. You may not alter or modify this information in any way, including the removal of this copyright notice.