


A Bearish End to a Bullish Month... Is it time to Panic?
Bitcoin dumps 3% on the final day of September. What does this mean for 'Uptopber'?

Just when things were looking bullish, with Bitcoin breaking out of a six-month downtrend, it faked everyone out. Is this a sign to panic and sell everything? No. Does this fakeout suggest we might head lower? Possibly. Is the bull run over? No. So, what does this mean for Bitcoin? Let’s take a look at the daily BTC chart.
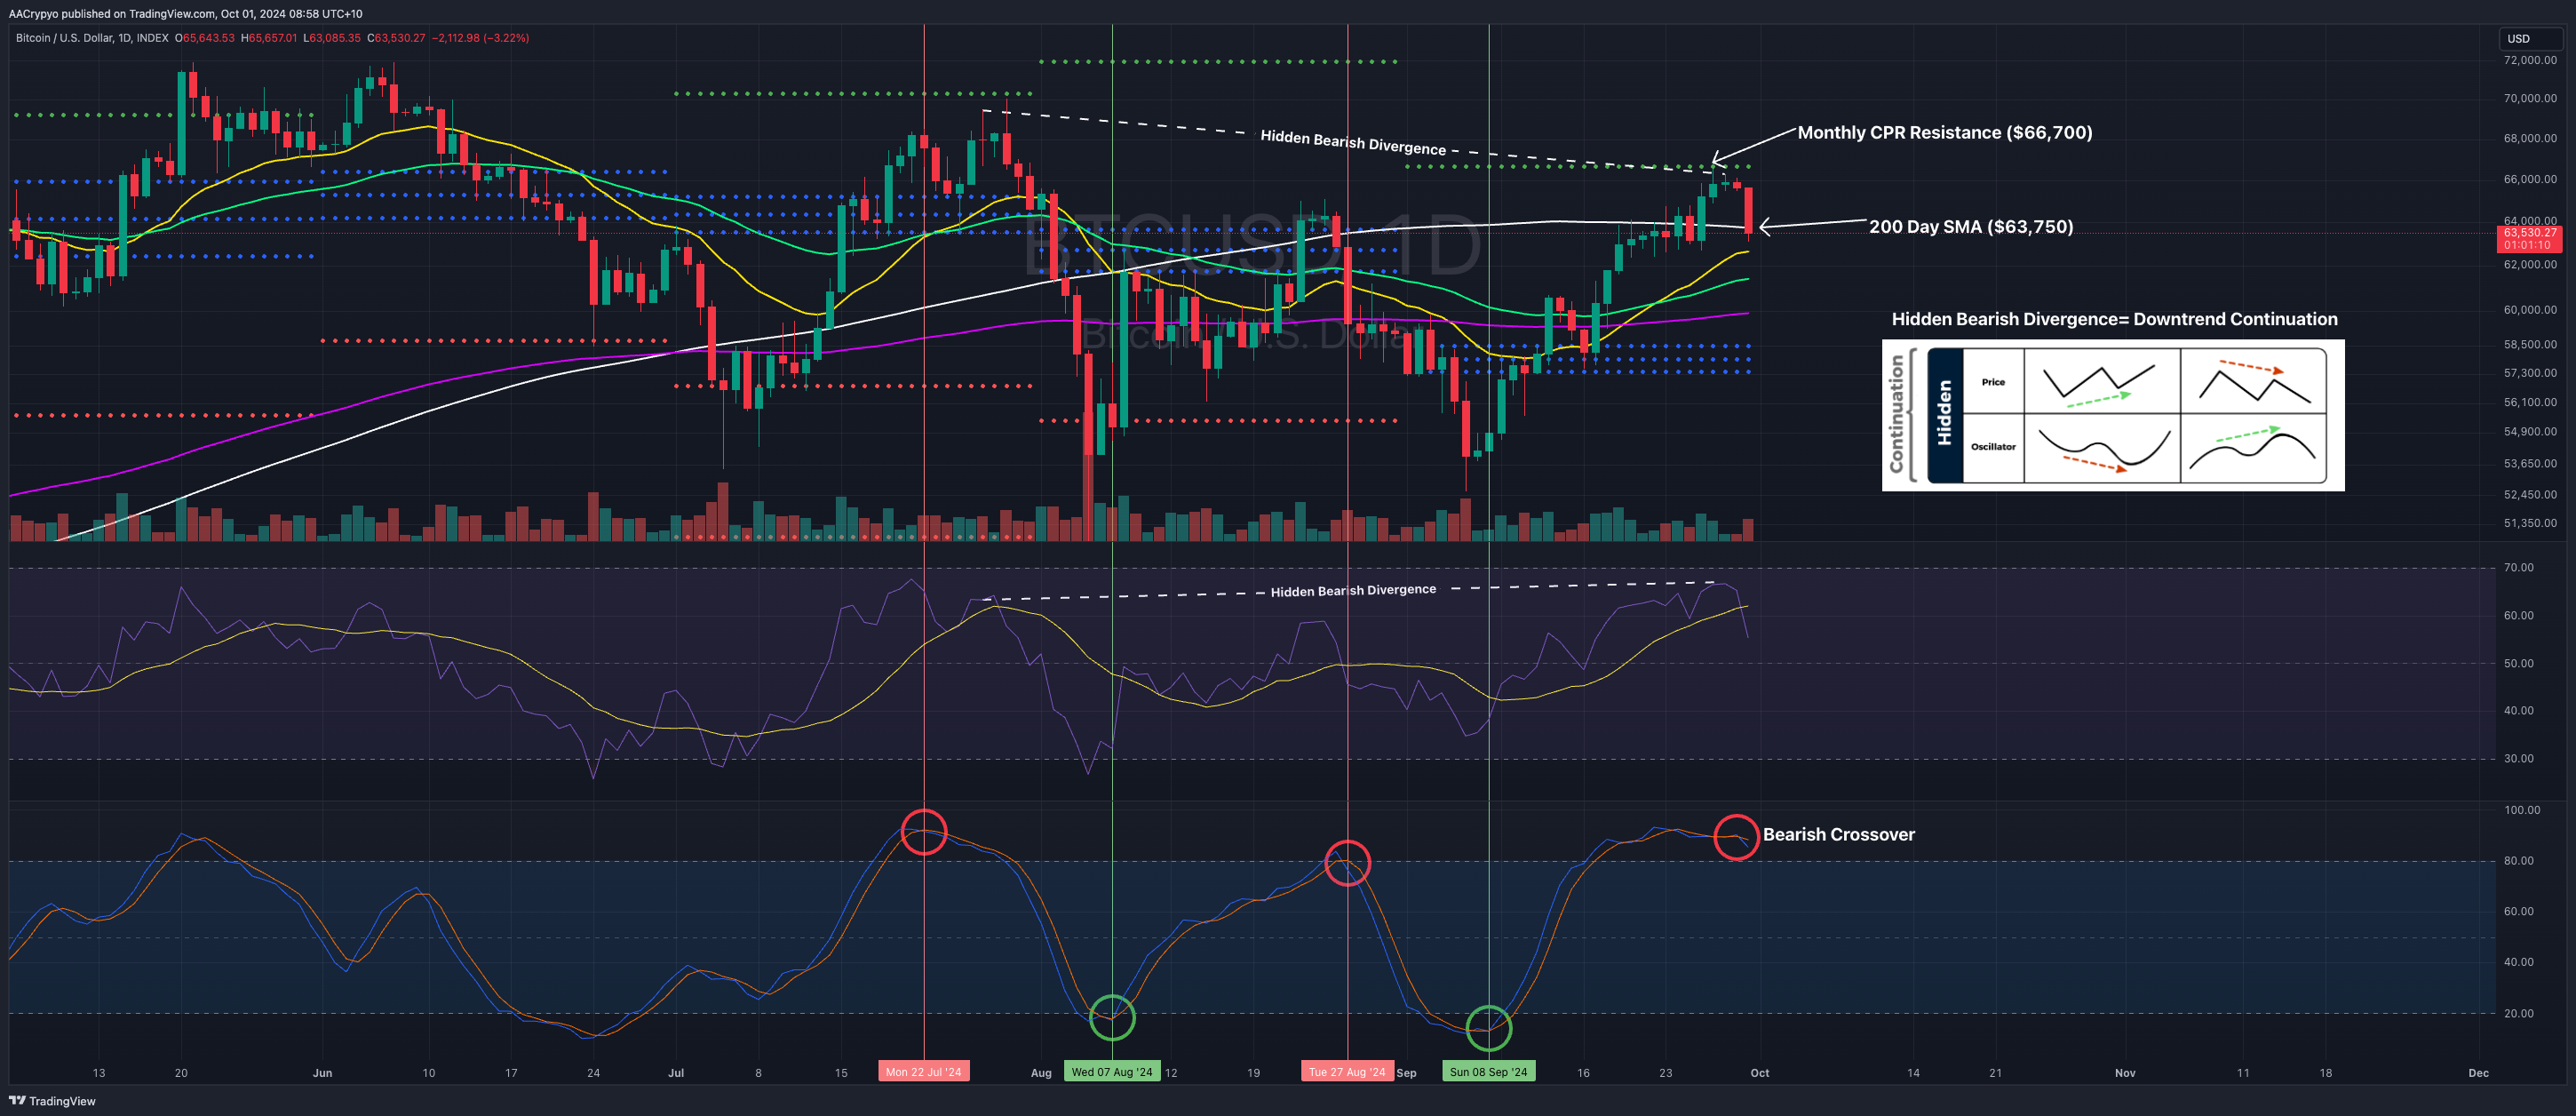
Yes, there are a lot of lines and colors on this chart, but it’s actually quite simple to understand. Let me break it down. Over the past week, BTC faced two key challenges: breaking above the 200-day SMA and surpassing the recent lower high. Over the last few days, we saw BTC successfully break and close above both of these levels—$63,800 and $65,000, respectively. This breakout also coincided with the top of the Bull Flag channel we've been tracking for a few days. Combine these technical factors with the fact that October (or as BTC enthusiasts call it, ‘Uptober’) was right around the corner, and there was a noticeable sentiment and momentum shift. All of these factors led to the Fear and Greed Index hitting a three-month high of 63, indicating increasing market greed. The old adage rang true: sell when others are greedy, buy when others are fearful. While it’s too early to say the market will turn fearful, and there’s no reason it should, greed was clearly building up.
Now, let's break down the second half of the chart. The two bottom panels, along with the monthly CPR, suggest more downside could be possible. The CPR (central pivot range) offers BTC key levels of support and resistance. After reaching the first level of CPR resistance, BTC was brutally rejected. This confirmed a hidden bearish divergence, followed by a bearish crossover from extremely high readings on the stochastics (shown in the bottom panel). I've marked recent stochastic crossovers to illustrate their impact and what might occur next. The red vertical lines signify a bearish crossover when the stochastics are overextended, which usually leads to bearish price action.
So, what does this mean for Bitcoin in the near term? Before any downside predictions, BTC still has a chance to close above the 200-day SMA and nullify any potential breakdown. However, if it fails to do so, the bearish signs from the daily chart could take a few weeks to play out. This might lead to lower BTC prices at the start of October before a bullish continuation. No, this doesn’t mean I’m long term bearish on BTC. The key point is that BTC has made a new higher high, and the next step is a pullback to create a higher low. As long as we stay above $52,600, a higher low will be set on the daily chart, confirming a bullish structure. So, there’s no need to panic—this could even be an opportunity to buy more BTC at discounted prices.
Remember, nothing goes up in a straight line. Corrections are healthy and provide great buying opportunities for your favorite coins. If market corrections stress you out, zoom out—the broader picture remains bullish. Or better yet, contact your Stormrake Crypto Broker for a deeper understanding of the market.
Stormrake Spotlight: FANTOM ($0.6932)
Fantom is back and continues to rally since our first mention at $0.50 two weeks ago. FTM has remained strong with the hype surrounding its upcoming migration. It was one of the few coins within the top 100 that actually rose instead of falling yesterday. However, if you decide to invest in FTM, proceed with caution. Not only is there broader market uncertainty, but FTM’s migration event could be a classic “buy the hype, sell the fact” scenario.
BTC/USD Key Levels and Price Action:

Unfortunately, Bitcoin took a turn for the worse overnight. It not only broke below all of its moving averages but also below the key $63,800 support level that took so long to break above. As BTC struggles to break back above this now-turned resistance, the next support level is the blue horizontal line. This $62,600 level has been pivotal in holding BTC up over the last few weeks of September. If this fails, expect BTC to drop lower, filling a fair value gap around $61,400.
BTC Total ETF Flows for 30 Sep: $ - 9.7 million
(ETF flow data is sourced from https://farside.co.uk/btc/ and reflects figures at the time of writing.)
ETH/USD Key Levels and Price Action:
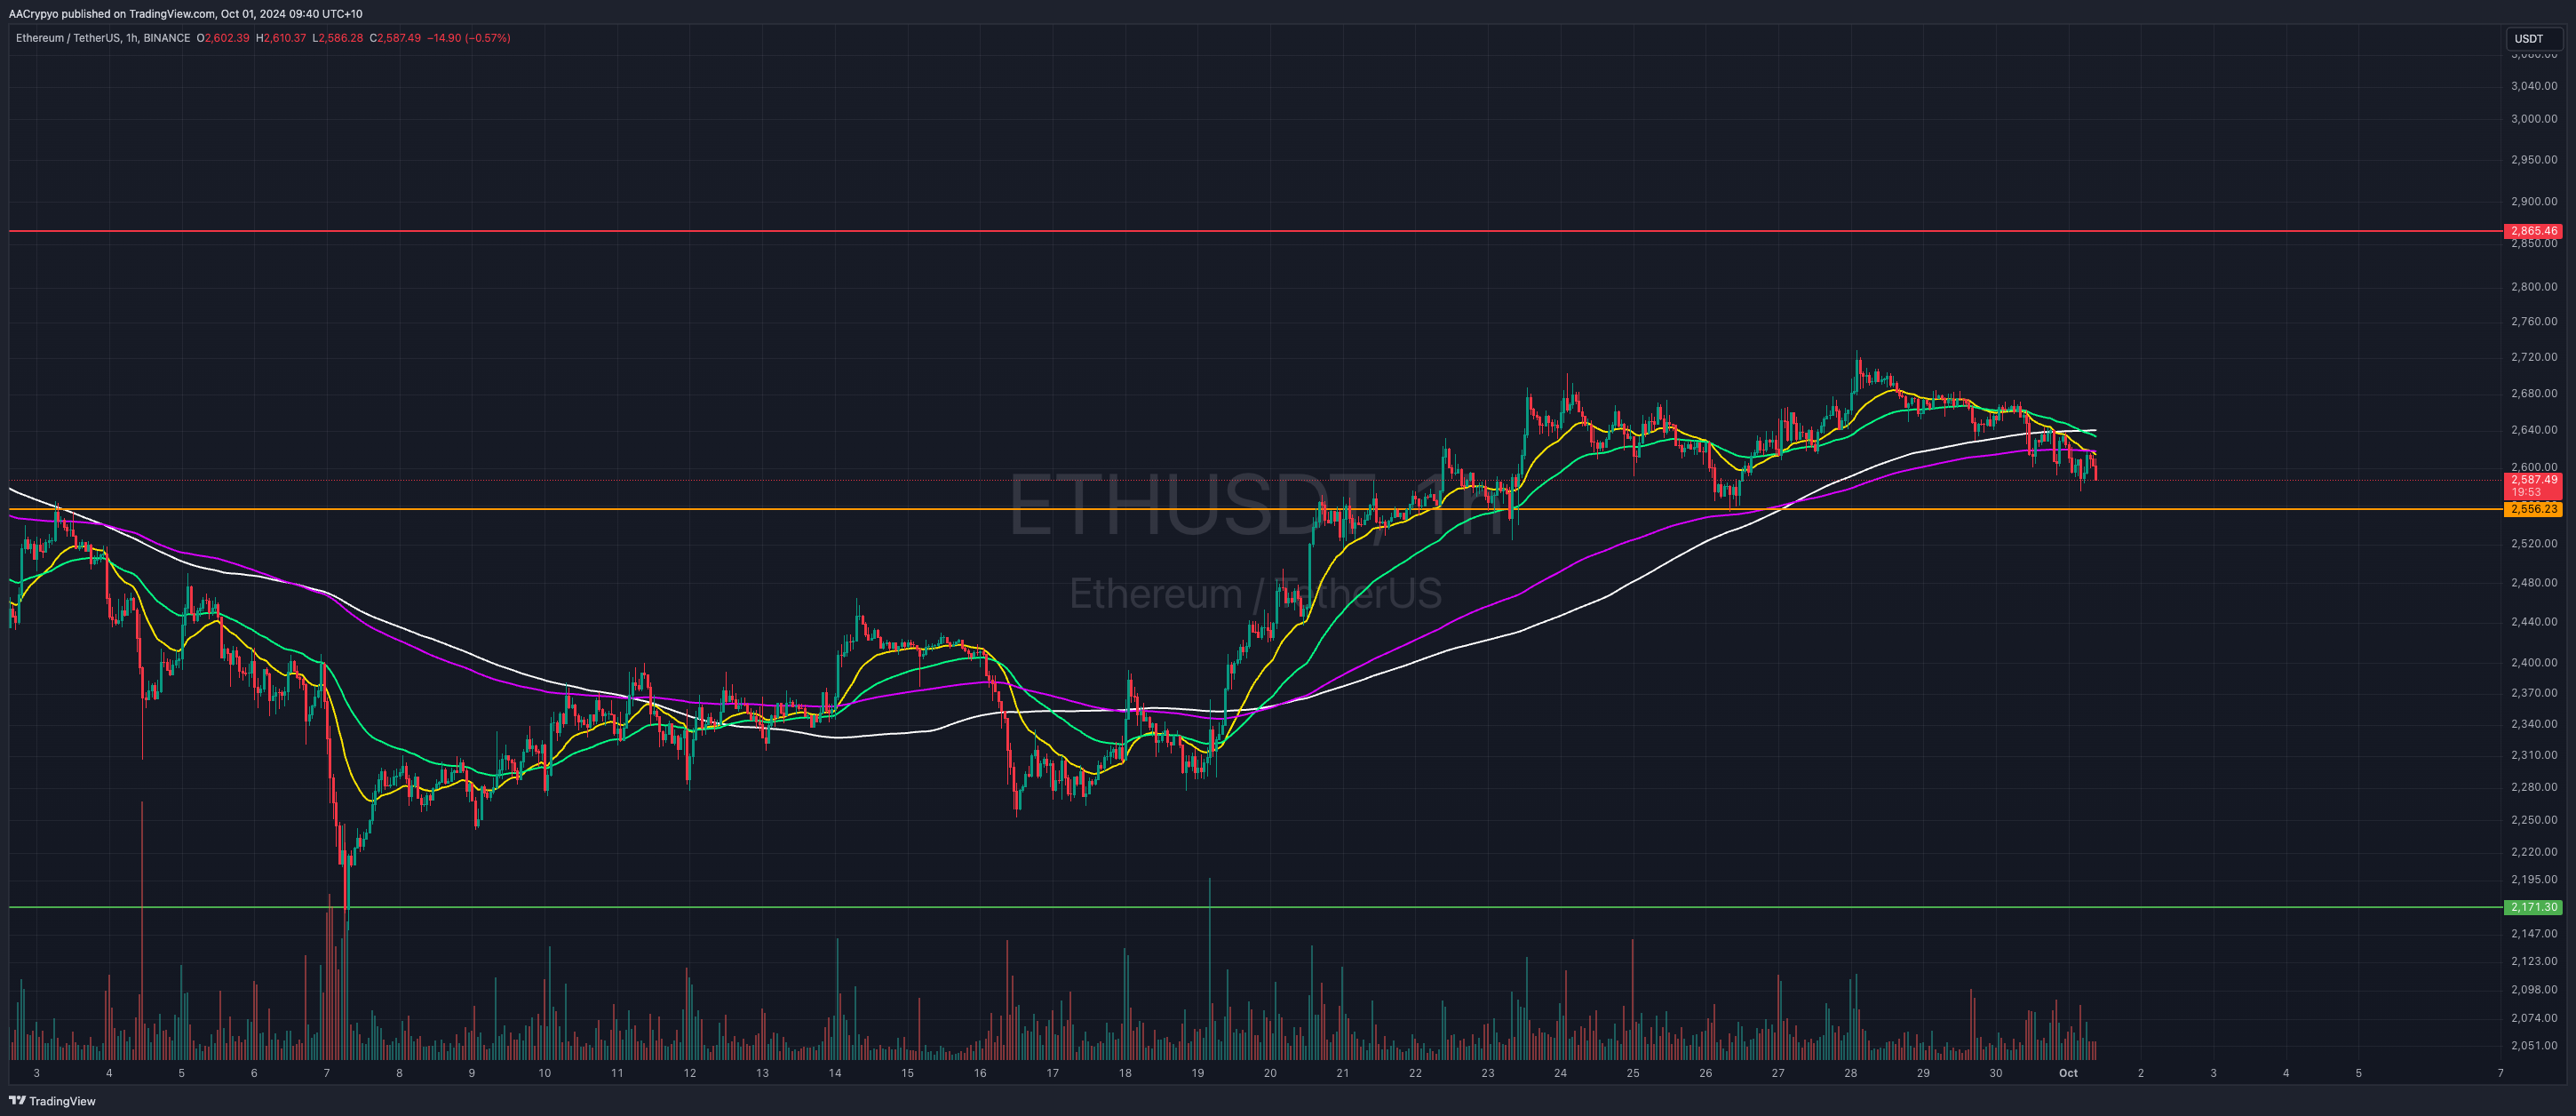
Ethereum seems to have finally decided on its direction after spending over a week consolidating post-breakout. Unfortunately for ETH bulls, it broke below all of its moving averages and is now heading toward retesting the key support at $2,556. Like the rest of the market, ETH is following BTC, so we can expect ETH to continue down if BTC’s downside persists.
ETH Total ETF Flows for 30 Sep: $ - 11.8 million
(ETF flow data is sourced from https://farside.co.uk/eth/ and reflects figures at the time of writing.)
Written by Alexandar Artis
To view this article and many others on our blog - please click HERE
If you enjoyed this Morning Note, feel free to open an account and gain access to more proprietary research and work with your very own dedicated crypto broker.
Disclaimer
All statements made in this material are made in good faith and we believe they are accurate and reliable. Stormrake does not give any warranty as to the accuracy, reliability or completeness of information that is contained here, except insofar as any liability under statute cannot be excluded. Stormrake, its directors, employees and their representatives do not accept any liability for any error or omission in this newsletter or for any resulting loss or damage suffered by the recipient or any other person. Unless otherwise specified, copyright of information provided in this newsletter is owned by Stormrake. You may not alter or modify this information in any way, including the removal of this copyright notice.